Key takeaways
- Top-floor flats score highest of the four home types we track, averaging 41.7 out of 100; new builds lowest, at 29.1.
- The ten highest-scoring areas are all in London, led by Brent at 49.
- Home type and place both matter: the four home types' averages span about 13 points, and the area scores span 16 (33 to 49).
- Orientation is held neutral in the index. A south or west-facing home scores higher than these averages.
Ask which UK homes overheat and most people say "flats in London". That is roughly right, but the reasons, and the exceptions, matter if you are choosing a home or deciding whether to fit cooling. So we measured it.
How we worked it out
The GetComfort Overheating Index runs the same scoring model the Home Cooling Checker uses across the real distribution of EPC ratings for four common home types in each of 133 areas, weighted by how common each type is there. Heat-island exposure is real, from Census density and settlement data. What we cannot yet read per home, such as which way it faces, is held at the same neutral value everywhere, so it does not distort the comparison between areas.
Home type: top-floor flats lead
- Top-floor flat41.7
- Victorian terrace38.9
- Loft conversion37.4
- New build29.1
Source: GetComfort Overheating Index, 133 areas.
- Top-floor flats sit directly under the roof, with nothing above to buffer the heat, and many face one way only.
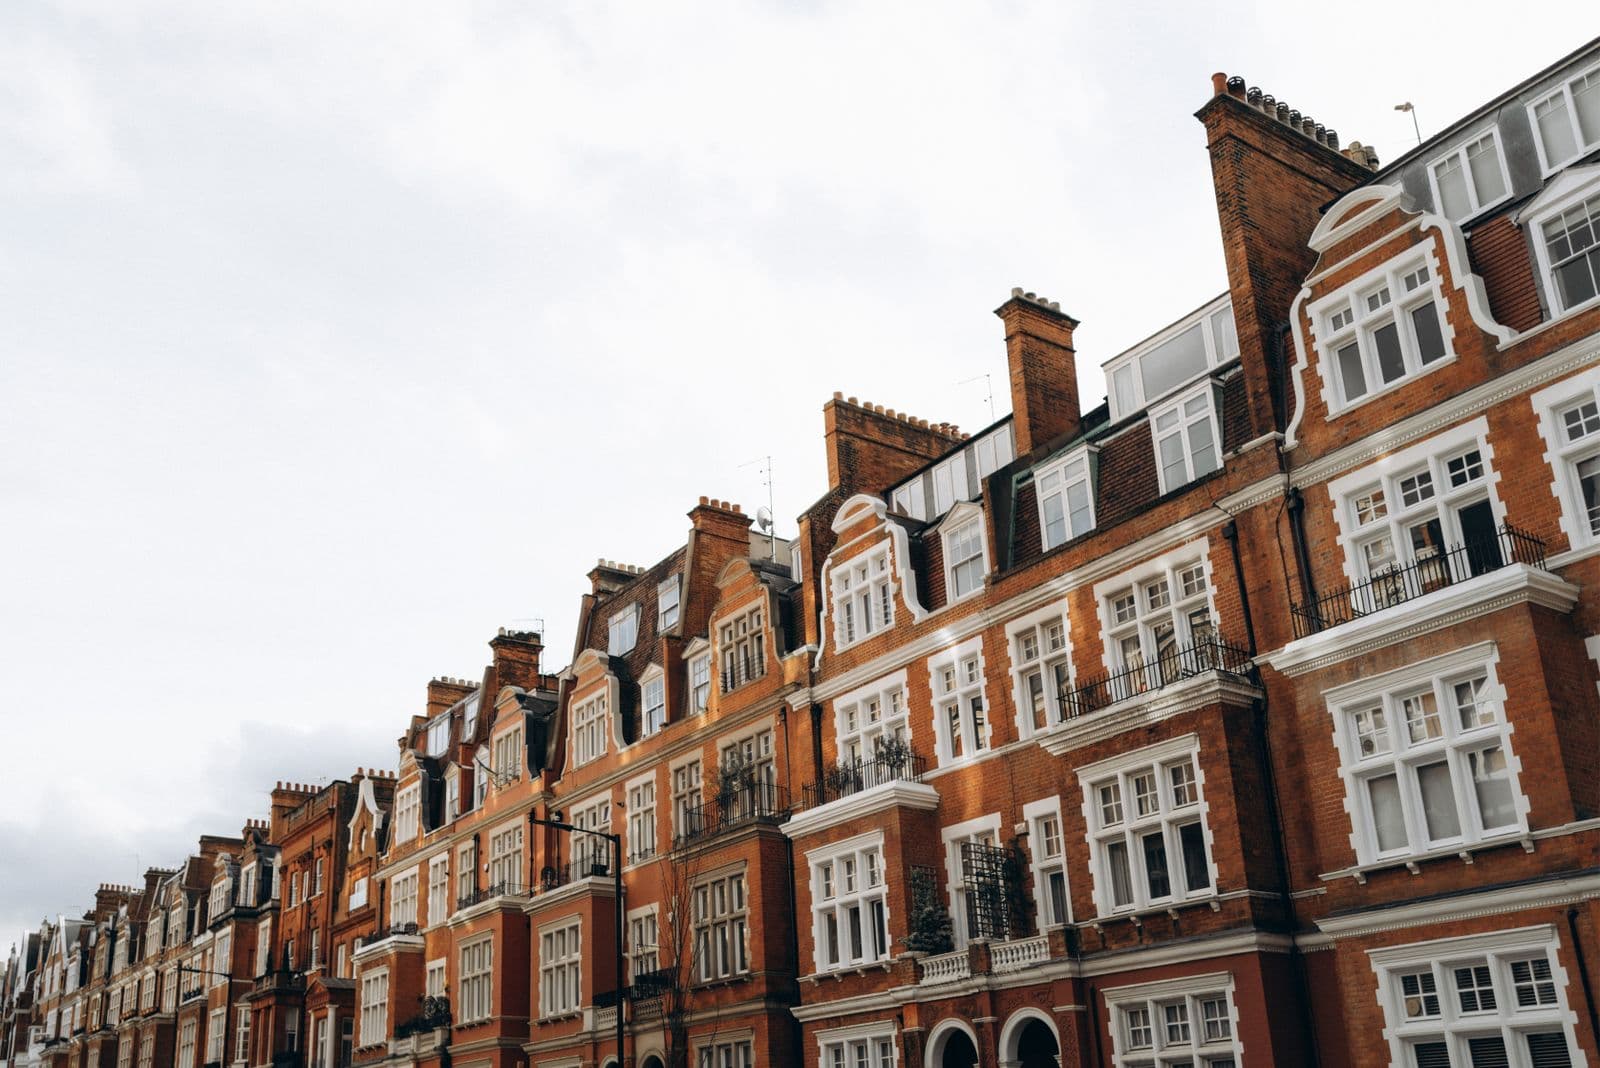
- Victorian terraces have solid walls that store heat, and small rear rooms that can be hard to ventilate.
- Loft conversions put bedrooms under a thin roof with large windows, and vary widely with how well they were insulated.
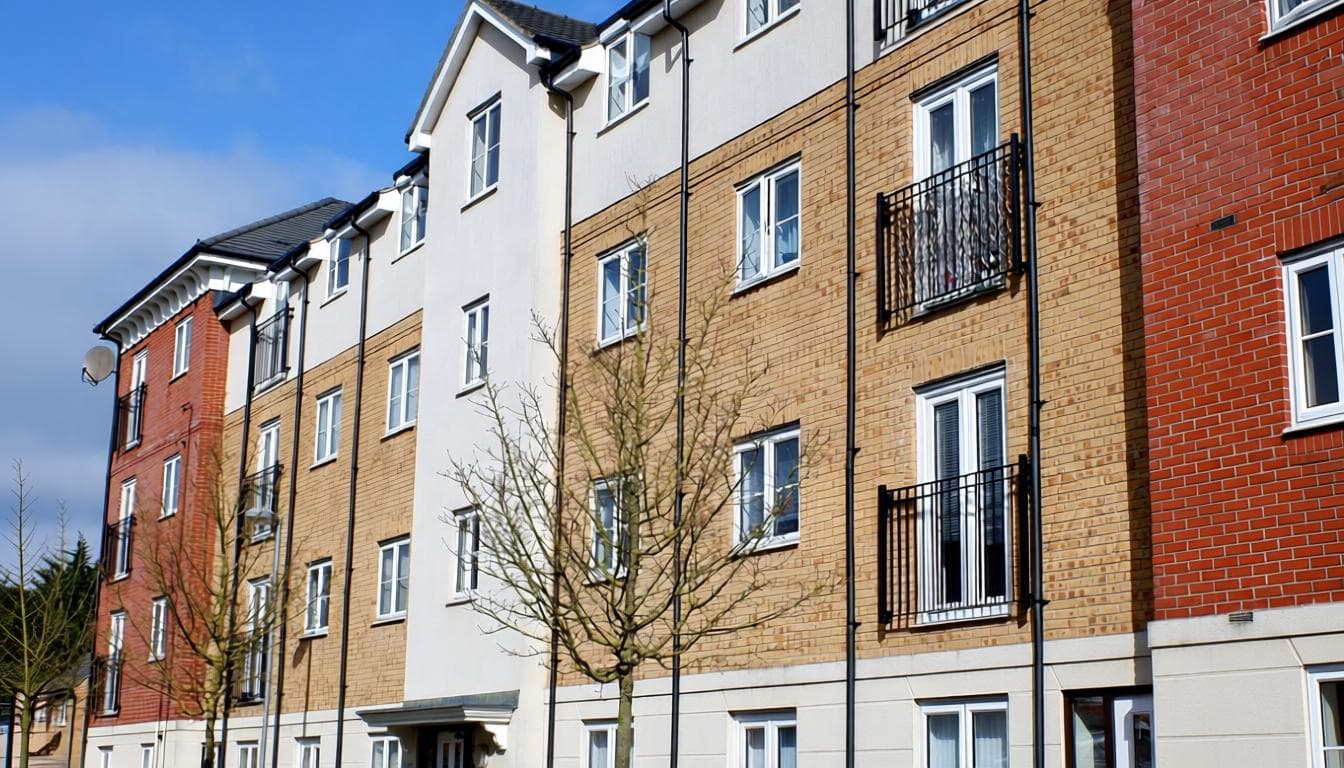
- New builds score lowest on average, but modern airtightness can still trap heat where ventilation is poor, which is why Part O now tests new homes for overheating.
The places that run hottest
| Rank | Area | Index score |
|---|---|---|
| 1 | Brent | 49 |
| 2 | Lambeth | 49 |
| 3 | Islington | 48 |
| 4 | Richmond upon Thames | 48 |
| 5 | Hackney | 48 |
| 6 | Haringey | 48 |
| 7 | Hounslow | 48 |
| 8 | Lewisham | 48 |
| 9 | Camden | 47 |
| 10 | Tower Hamlets | 47 |
London dominates the top of the table, driven by its high share of flats, its old housing stock and a strong urban heat island. At the other end, Winchester, Lichfield, Dover, Ashford, Telford score lowest, with more houses, newer stock and less dense surroundings. The median area scores 38.
18% of Brent homes are top-floor flats
26,607 of 150,788
59 m²
median floor area
£493
median annual heating cost
EPC band distribution
26,607 top-floor flats in Brent with an EPC on record
Greener bands are more energy-efficient; red bands (E-G) are poorer-fabric homes that trap summer heat.
| EPC band | Homes | Share |
|---|---|---|
| A | 2 | 0% |
| B | 1,111 | 4% |
| C | 9,515 | 36% |
| D | 11,397 | 43% |
| E | 3,827 | 14% |
| F | 564 | 2% |
| G | 191 | 1% |
When these homes were built
Construction era of 26,300 top-floor flats in Brent
- pre-1919 39%
- 1919-1944 23%
- 1945-1999 29%
- 2000+ 9%
| Era | Homes | Share |
|---|---|---|
| pre-1919 | 10,172 | 39% |
| 1919-1944 | 5,947 | 23% |
| 1945-1999 | 7,711 | 29% |
| 2000+ | 2,470 | 9% |
Real EPC and property-intelligence data via HomePortfolio, aggregated for top-floor flats in Brent. Data as of 11 July 2026.
What the averages hide
An average is not your home. Two things push an individual home well above its area’s score: main rooms facing south or west, and being single-aspect so air cannot flow through. A heat-vulnerable occupant raises the stakes further. The checker asks about all three.
The climate is moving the whole table
The index scores homes against today’s climate. The Met Office’s local projections show the number of days above 30°C rising in every area as the world warms, fastest in London and the south-east. A home that is borderline now will be over the line more often, which is why a moderate score today is worth acting on with the cheap passive measures first.
How to use the index
- Buying or renting: compare the home type and area, then look at the specific flat or house, especially its floor and which way it faces.
- Landlords: top-floor and loft rooms in high-scoring areas are where tenant complaints and heat-health risks concentrate.
- Homeowners: use your area and home type as a starting point, then check your own address for a score based on its real records.
Frequently asked questions
What type of home overheats the most?
In our Overheating Index, top-floor flats, averaging 41.7 out of 100. The roof above them absorbs heat all day, and many cannot be cross-ventilated.
Do new-build homes overheat?
They score lowest on average in our index, but some do overheat, especially small, single-aspect flats. Since June 2022, Part O requires new homes in England to be designed to limit overheating.
Sources
Solomon Amos, Founder & Technical Architect, GetComfort
Solomon Amos is the founder and technical architect of GetComfort, and built HomePortfolio, the property-intelligence platform behind this site's property data. He is not an installer: every accreditation and planning claim here is sourced to its primary guidance, as the methodology sets out. More about the author